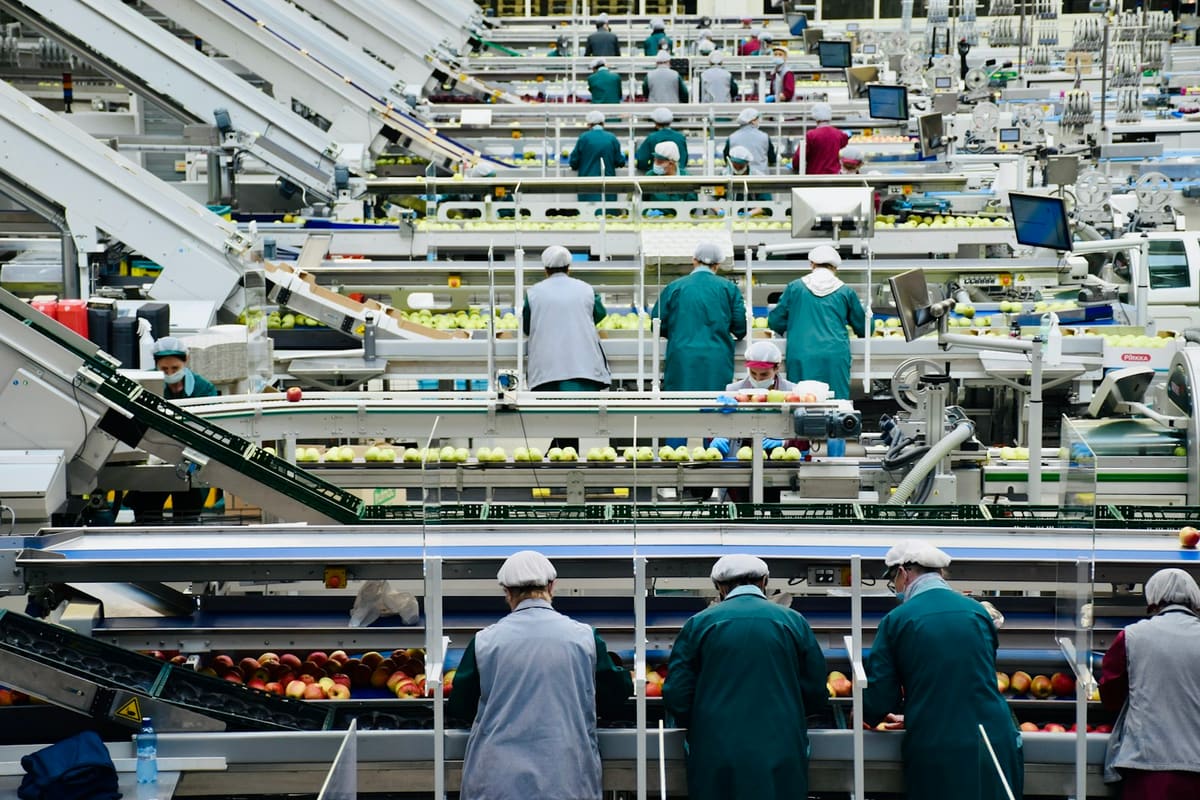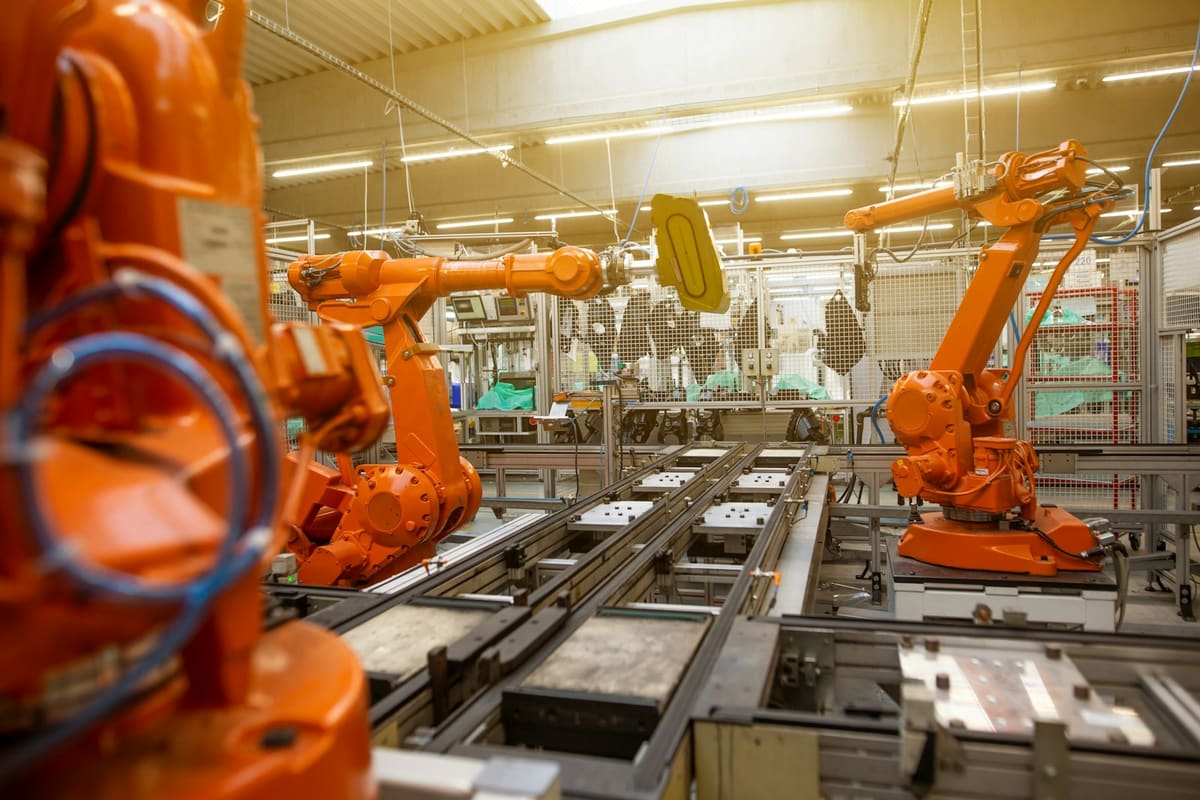
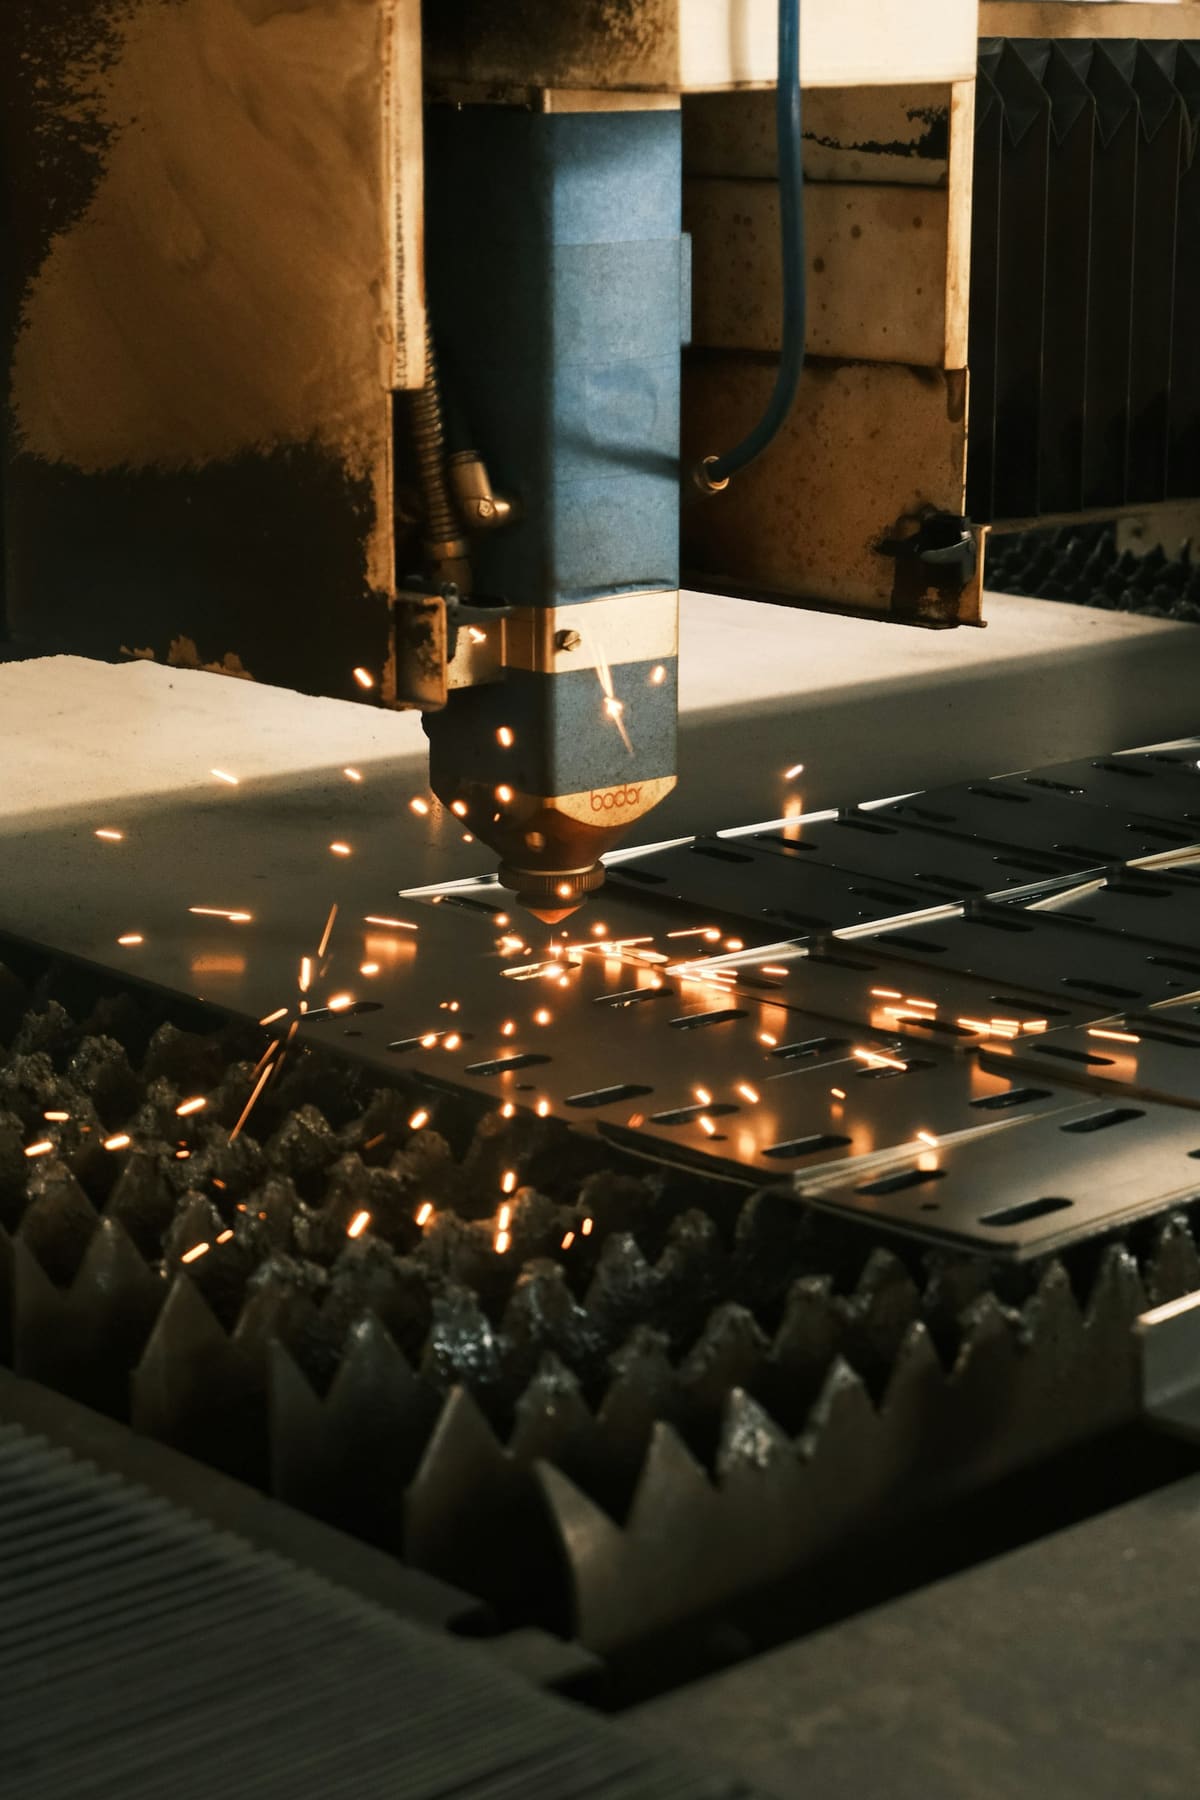
A CNC job-shop owner in Rajkot told me his machines "basically never stop." From where he stood at the gate, that looked true. The spindles were turning, the operators were busy, the floor sounded healthy. Then we put a counter on his three main VMCs for two weeks and the number that came back was 54%. More than four working hours in every ten were going somewhere he couldn't see.
That number is OEE, and it's the single most honest score a manufacturer can keep on a machine. Most Indian plants have never measured it, so they manage output by gut and by the loudest breakdown. Once you can see OEE, the hidden losses stop hiding, and improving it becomes a list of specific, fixable things rather than a vague push to "produce more".
What is OEE and how do you calculate it?
The three numbers inside OEE
OEE looks like one figure, but it's three measurements stacked together, and that's what makes it useful. A low score on its own tells you nothing. The breakdown tells you exactly where the loss lives.
Availability: is the machine even running?
This is planned production time minus every stop, divided by planned time. Breakdowns count, but so do the quiet stops most owners never log: waiting for material, waiting for a setter, waiting for the right die, the operator stepping away for a QC sign-off. These small waits are where the Rajkot floor was bleeding, and they almost never show up in a breakdown register.
Performance: is it running at full speed?
A machine rated for 60 parts an hour that's actually turning out 45 has a performance loss, even though it never "stopped". Worn tooling, conservative feed rates, minor jams cleared in seconds: they don't register as downtime but they quietly drag the number down.
Quality: are the parts good first time?
Every rejected or reworked part is machine time you paid for and threw away. On a fastener or component line, a 4% reject rate sounds small until you price the metal, the power, and the re-run against it.
A worked example from one Rajkot floor
Here's the actual maths from that job-shop, on its busiest VMC. Over a 26-day month it had 600 planned production hours.
- Availability: 492 of 600 hours actually running = 82%. The 108 lost hours were mostly setup changeovers and material waits, not breakdowns.
- Performance: running at 75% of rated cycle speed = 75%, mostly cautious feeds on older tooling.
- Quality: 96% good parts first time = 96%.
Multiply them: 0.82 × 0.75 × 0.96 = 0.59, an OEE of 59% on the machine that mattered most. The eye-test "never stops" was hiding a machine working at a little over half its real capacity.
Lifting the lead machine from 59% to 73% was worth roughly an extra ₹2.1 lakh of billable output a month on that one VMC, with no new machine bought. The fixes weren't dramatic: a shadow board for dies to kill setup hunting, a standard changeover sequence, and re-ground tooling so the operators stopped nursing the feed rate.
Where the downtime actually hides
When plants finally measure availability, the same culprits show up across very different factories. Reducing machine downtime is mostly about attacking these, in this order:
The order surprises most owners. Catastrophic breakdowns feel like the enemy because they're loud, but added up over a month the small, repeated waits cost far more. The good news is they're cheaper to fix.
"I'd have sworn my machines were running flat out. The counter showed me four hours a day I was paying for and not selling. That changed how I run the place."CNC job-shop owner, Rajkot
How to start measuring OEE without a big spend
You don't need to wire the whole floor to begin. The sequence that works for a mid-sized plant:
- Pick your bottleneck machine. The one that decides your output is the only one worth measuring first.
- Log every stop for two weeks with a reason code. Even on paper, the pattern will be obvious.
- Get the data off the machine automatically once the habit sticks. Even older machines can report runtime cheaply, which we cover in retrofitting old machines with shop-floor IoT.
- Attack the biggest loss bucket first, usually changeover, and re-measure.
In an automotive plant the same shift records also have to survive an audit, which is the argument in IATF 16949 traceability without a register.
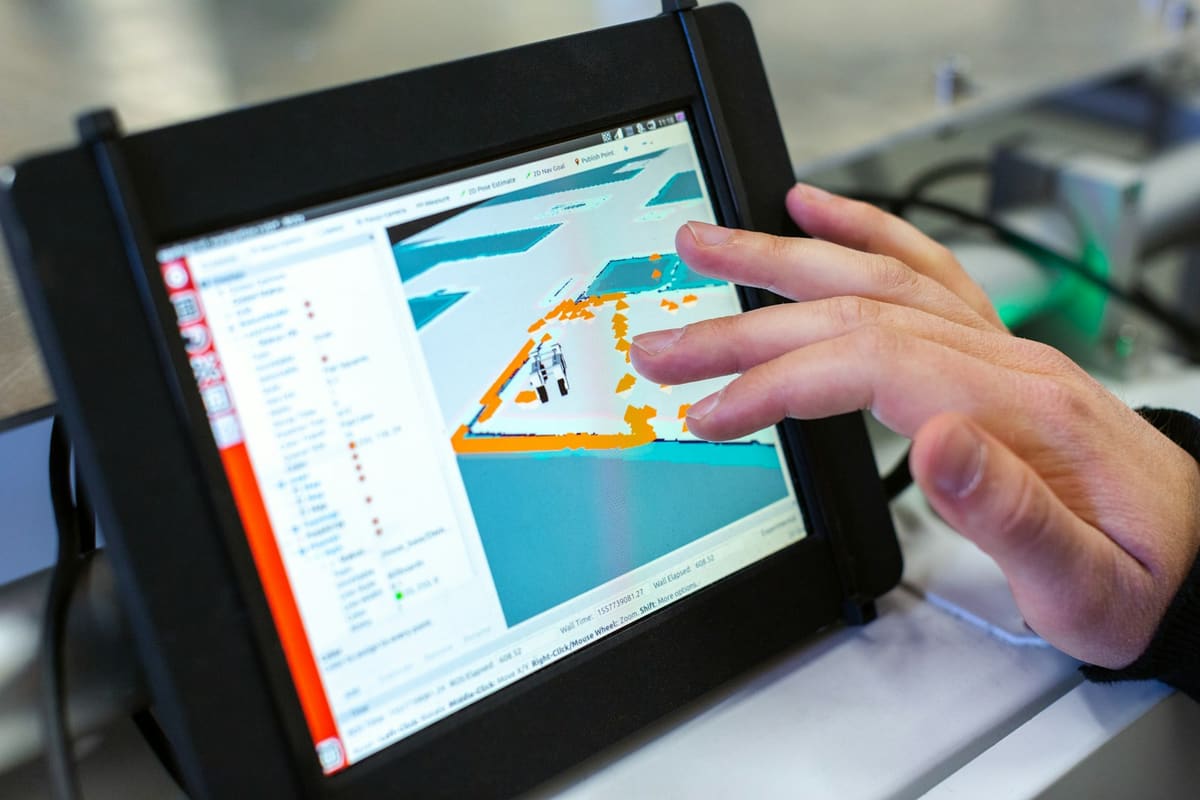
OEE belongs alongside the handful of numbers every factory owner should track, because it connects directly to delivery dates and capacity decisions. When the figure lives on a shared screen instead of in a supervisor's head, the whole floor starts protecting it. Production tracking software like Facto captures availability, performance, and quality automatically and turns them into one live score per machine. If you want to see what that looks like on your own floor, see how Facto maps to your line or book a walkthrough.